
AgentCore X: Your Agent Is Fully Traced. That Still Does Not Mean It Was Right.
Part 10: AgentCore now ships free OpenTelemetry traces and thirteen LLM judges, but the platform still sells the judge rather than the verdict: calibration, golden sets, and thresholds stay yours.

Your Agent Is Fully Traced. That Still Does Not Mean It Was Right.
AgentCore now ships free OpenTelemetry traces and thirteen LLM judges, but the platform still sells the judge rather than the verdict: calibration, golden sets, and thresholds stay yours.
AgentCore Observability and AgentCore Evaluations hand you free OpenTelemetry spans and thirteen LLM judges. Neither one knows whether your agent was correct.
Your agent is fully traced and continuously scored, and still nobody can say whether the report is correct. Judges ship free; the verdict does not.
In this article: You will learn what AgentCore Observability and AgentCore Evaluations actually give you for free, how three evaluation levels turn a quality number into a diagnostic, where the platform stops (calibration, golden sets, thresholds), and how to wire a promotion gate that fails the build when the agent is wrong. By the end, you will know the revised boundary: the platform sells the judge; it does not sell the verdict.
AgentCore series Part 10
The market-intelligence agent can browse, compute, remember, and authenticate as the analyst who asked. It produces a weekly report in four to six minutes. It costs a known amount. Every step is traced.
Nobody in the building can tell you whether the report is correct.
That is the gap this article closes. Start with a walk-back, because product claims expire faster than architecture ones.
The correction
The plan used to be simple: independent verification is the thing no platform sells. You get traces from AWS; the evaluation suite is yours; go build it.
Then AgentCore Evaluations went generally available on March 31, 2026, with thirteen built-in LLM-as-a-judge evaluators, continuous sampling of live traffic, and a documented CI/CD regression workflow. AWS sells the evaluation suite now.
That is the fourth time in six weeks of research that a concrete claim has expired. Browser and code-interpreter toolkits shipped first-party. Memory store turned out to be first-party. Policy went GA. Now Evaluations.
Which is worth naming, because it is the strongest evidence for the series thesis. The specific claims keep dying. The scorecard has not moved. Every correction still fits the same seven-component frame. “What is a managed version of what” is stable; “which SKUs exist this quarter” is not. Learn the components; rent whatever the hyperscaler is selling this month.
Revised claim, sharper than the one it replaces:
The platform sells the judge. It does not sell the verdict.
What you get for free
Start with Observability, the easy half, and genuinely free.
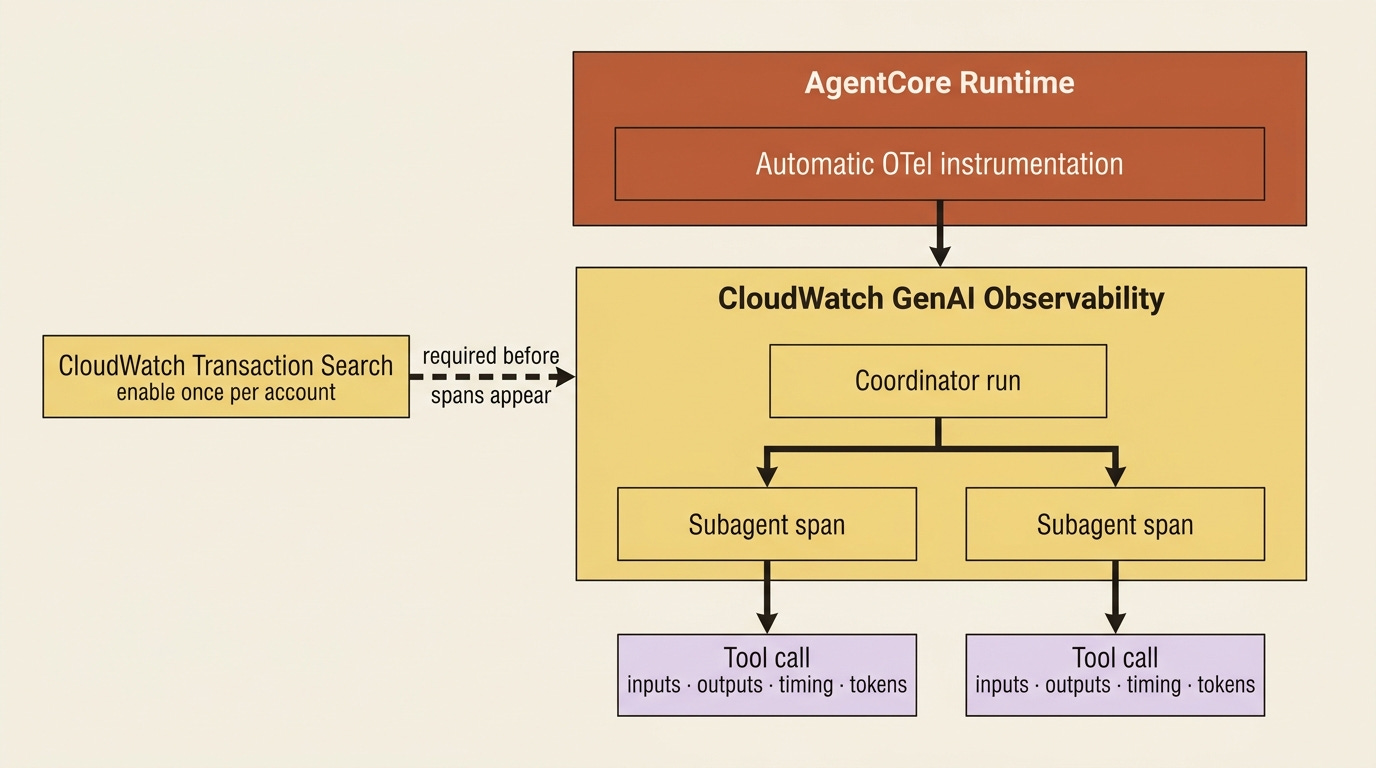
When your agent runs in AgentCore Runtime, the runtime instruments it with OpenTelemetry automatically. No ADOT setup, no instrumentation library, no decorators. Deploy, and you have traces.
Run the same agent outside Runtime, in a notebook or your own container, and you add the AWS Distro for OpenTelemetry SDK plus the LangChain instrumentation library yourself. Same data, more assembly.
One setup step still bites: CloudWatch Transaction Search must be enabled, once per account, before traces and spans show up. You discover this after deploying, staring at an empty dashboard, and concluding that instrumentation is broken. It is not broken. It is off.
What you get is the orchestration hierarchy on the CloudWatch GenAI Observability page: the coordinator’s run at the top, a child span for each subagent, and the analyst path that follows. Inside each span, tool calls with inputs, outputs, timing, and token usage.
Two payoffs are better than they sound.
You can prove concurrency from wall-clock timing. When research fans out to three parallel browser subagents, the traces confirm that they actually ran in parallel rather than politely queueing. “It should be concurrent” and “the spans overlap” are different claims.
You can find the failing hop. When a browser navigation or a code run fails, the trace tells you which subagent and which tool call. In a multi-agent system, that is most of the debugging.
Pattern check: Observability implements the instrumentation half of integrated feedback loops. It answers “what happened.” It has no opinion about whether what happened was good.
The instrumentation gap
Free traces cover the platform’s view: model requests, tool calls, and spans. They do not cover your harness’s internals.
The things you most want in production are framework-level events. Which validator rejected which plan step. Why the loop stopped. What retrieval returned and what got dropped. A subagent handoff and the exact payload that crossed it. None of that is a model request, so none of it is a platform span.
Both harnesses give you the injection point:
DeepAgents:
middleware. Wrap a node, emit a span, carry your own attributes.Claude Agent SDK: hooks.
PreToolUse,PostToolUse,Stop,SessionStart,SessionEnd, andUserPromptSubmitare exactly the six places you want a span.
Emit into the same OTel context, and your validator rejections land in the same trace as AWS’s tool calls. That is the difference between a trace that shows that the agent called a tool and a trace that shows that the agent called a tool, your validator refused the result, and the loop retried with a narrower query. One is telemetry. The other is a story.
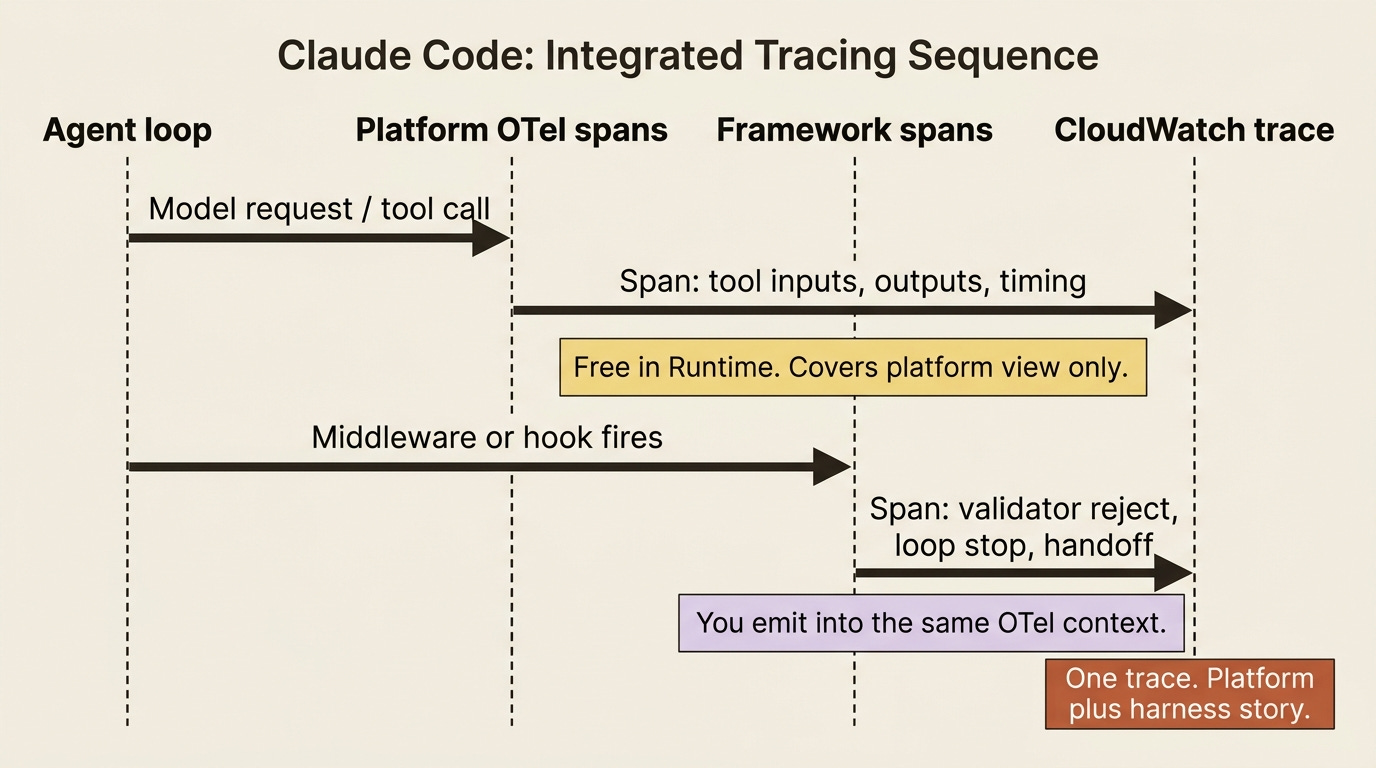
In production: platform spans plus framework spans in one trace is the whole goal. Getting there costs a middleware or a hook. Skipping it means your most expensive debugging sessions happen where the traces go dark.
If you are a paid subscriber, thank you. Your support makes this work possible.
If you are a free subscriber and find these articles useful, please consider upgrading. A paid subscription is $80 per year or $8 per month.
